
Environmental and Traffic Congestion Benefits of Cycling
Sharing Road Space (Granville et al., 2001)
- Cycling is environmentally friendly as the mode of transport is silent and produces no emissions. By contrast, motorised transport is noisy, while its emissions reduce air quality and add to the “greenhouse” gases contributing to global warming.
- Cycling can also reduce congestion and the journey times of other road users, particularly in urban areas. Businesses may be unwilling to be based in an area constantly beset by traffic congestion which can cause delivery and health problems and result in a negative effect on the local economy.
- When compared with previous studies, the TRL research found that, “avoiding stress and congestion, rather than getting physical exercise and saving money, now appear to be more important factors”, as to why people take up cycling.
- Noland (1996) found that for a perceived increase in safety of 10%, an increase in cycling of over 10% was observed. TRL found that, “general attitudes to cycling were positive: cycling was thought of as healthy, a way to relieve stress, and a good family activity”.
(McGrath, )
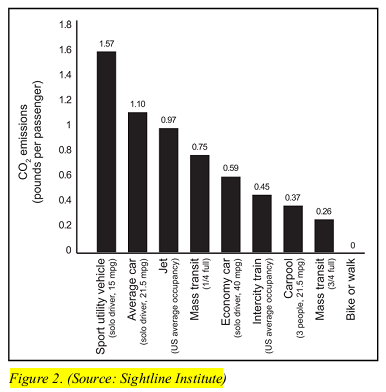
Climate Protection
- While a solo driver in an average car releases about 1.1 pounds of CO2 per mile, a bicyclist releases none. […]Even a Toyota Prius releases about .6 pounds of CO2per mile (see Figure 2).
Improved Safety
- Increasing the number of cyclists on your streets can save lives. That is what Peter Jacobsen found in his 2003 report “Safety in Numbers”, in which he noted that “motorists adjust their behavior in the presence of people walking and bicycling,” leading to a reduction in the rate of collisions between motorists and bicyclists and walkers.
- Recent data from the Portland Office of Transportation reinforced Jacobsen’s finding: cycling rates soared since the early 1990s while the crash risk per rider dropped by about 70% (see Figure 3).
(Cavill & Davis, 2008b).
- Improved Air quality:
- 24,000 vulnerable people die prematurely each year and similar numbers are admitted to hospital because of exposure to air pollution from particulates, ozone, and sulphur dioxide, most of which is related to road traffic. Air quality is often worse in more deprived areas and affects vulnerable populations more, exacerbating the symptoms of people with asthma, for example
- It is often assumed that cyclists (and pedestrians) are exposed to higher air pollution levels than motor vehicle occupants because they are physically unprotected, […]However, in slow moving traffic, typical of rush-hour traffic, car occupants can be exposed to higher pollutant levels
- “Cars offer little or no protection against the pollutants generated by vehicle traffic. Road users can be exposed to significantly elevated levels of pollutants as they are, in effect, travelling in a ‘tunnel’ of pollution.
- Car drivers also suffer up to two to three times greater exposure to pollution than pedestrians in slow moving traffic
- Danger:
- It has been observed that the greater the motor traffic volumes the lower the levels of non-traffic street activity. This is not surprising since more motor vehicles means more noise and air pollution, and greater perceived risk for those on foot and travelling by bike,
- A review of 250 20mph zones in England, Wales and Scotland found that crashes involving cyclists had fallen by 29%. In addition, crashes at relatively low speeds (20mph) tend towards less severe injuries and few deaths in contrast to those occurring at speeds of 30mph and above.
- Increased play and activity opportunities for children:
- The Department of Health recommends that all young people should participate in physical activity of at least moderate intensity for one hour per day […]. 40% of boys and 60% of girls do not undertake this on most days of the week.
- Some of the reduction in activity levels in recent years has come about because of an increasingly hostile traffic environment, which has contributed to a strong decline in child cycling
- “Children’s need for safe access to a diverse outdoor environment on the front street and opportunities for extending their free range mobility along footpath networks and traffic calmed roads, needs to be incorporated in the estate design and management process.”
- “The sad reality is that most streets are now linear car parks with a central race track.”

(Toronto Public Health, 2012) – Road to Health: Improving Walking and Cycling in Toronto
- Transportation system benefits:
- Investing in active transportation and public transport can also help to reduce congestion, reduce delays from collisions, reduce the unreliability of travel time, reduce fuel and transport costs and improve residents’ ability to access facilities and services.
- Seventy percent of Toronto commuters use cars, fuelling consistent traffic congestion in and around the city and metro area. An Organization for Economic Co-operation and Development report estimated that traffic jams cost Toronto $3.3 billion per year.
- In the Board’s Scorecard on Prosperity, Toronto was ranked last for commute times and 1th of 23 global cities on transportation.
- The strain on Toronto’s transportation systems will only increase, as population and employment in the Greater Toronto and Hamilton Area are expected to grow by 50% between 2001 and 2031
- Social, economic and environmental benefits:
- Active transportation as an alternative to car travel is associated with a number of social benefits, including increased social interaction, social networks and social capital
- Increasing the mode share of walking and cycling may also contribute to reduced crime.
- Improving the walking environment can increase economic value of local properties. Homes within walking distance of schools, parks and shopping sell for more in the United States.
- …increases in sale and rental prices of both residential and commercial properties.
- In Toronto, only 66% of adults report a strong sense of belonging to their local community.
- There are also ways in which active transportation generates “net” economic benefits – economic activity that would not have otherwise occurred. For example, cycling expenditures are more likely to remain within the local economy rather than going almost directly to companies out of the city or province (as do expenditures on gasoline).
- Cortright (2007) concludes that Portland keeps $800 million that would drain out-of-town if local residents drove cars at the same rate as an average U.S. city. By spending less money on gasoline, a higher proportion of Portlanders’ expenditures on goods and services are likely to remain inthe local economy.
- Research indicates that investments in cycling infrastructure generate more jobs per dollar spent than investments in road-only infrastructure. Cycling projects create a total of 11.4 local jobs for each $1 million spent. Pedestrian-only projects create about 10 jobs per $1 million and road-only projects create 9.6 jobs per $1 million.
- Investing in active transportation may be a particularly cost-effective way of reducing greenhouse gas emissions. The Intergovernmental Panel on Climate Change (IPCC) suggests that packages of walkways, bikeways and bus/rapid transit could reduce greenhouse gas emissions from light-duty vehicles by 25% at a cost of only US$33 per tonne of CO2 equivalent. By comparison, the IPCC estimates that reductions from high-efficiency vehicles would cost less than US$110 per tonne of CO2 equivalent.
